
San Clemente's Wealth is Downtown.
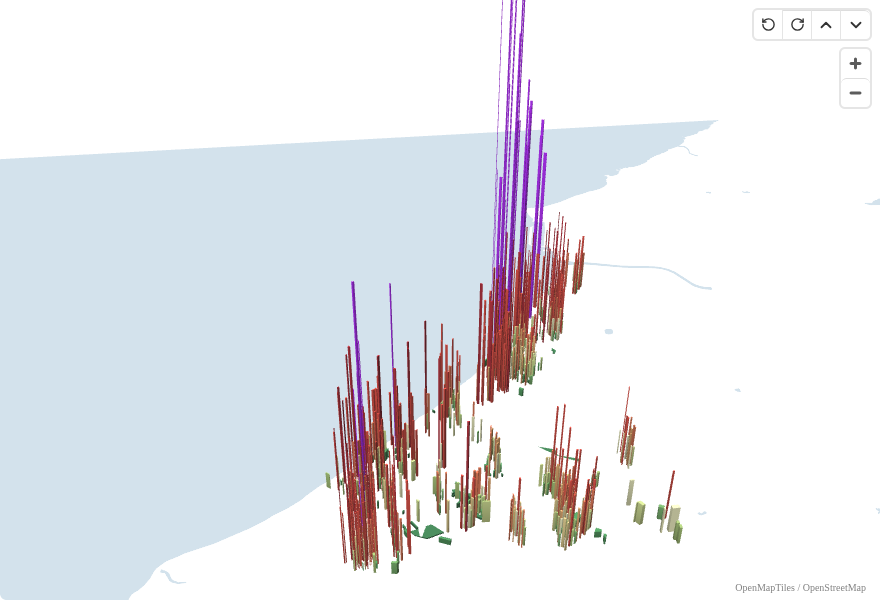
An Urban3-style 3D map of San Clemente's assessed property values, showing where the city's fiscal productivity concentrates.
Most people think of San Clemente as a quiet beach town. What they don't see is the fiscal engine underneath the surface. Using public data from the Orange County Treasurer-Tax Collector, we mapped the assessed value of every parcel in the city, normalized by acreage, and extruded the result into three dimensions.
The tallest spikes on this map are the most fiscally productive land in San Clemente: small lots generating enormous assessed value per acre. The flattest areas are the least productive, consuming the same roads, water, sewer, and emergency services while contributing far less.
What the map shows
San Clemente has 9,591 parcels with a combined assessed value of $10.4 billion. The median value per acre is $6.5 million, driven by the city's small residential lots on expensive coastal land.
The pattern is consistent with what Urban3 finds everywhere: the traditional, walkable parts of a city, where lots are small and buildings sit close to the street, generate far more value per acre than auto-oriented development on larger lots.
The highest-value parcels cluster along the old downtown core near Avenida Del Mar, where small commercial and residential lots pack enormous assessed value into tiny footprints. Condos and townhomes (877 parcels, median $6.8M/acre) outperform single-family homes on a per-acre basis because they put more housing on less land.
What this means for San Clemente
This data tells a simple story. The most productive land in San Clemente is the land with the least infrastructure per unit of value: compact lots, shared walls, walkable streets. Every time the city approves development on large lots at the suburban fringe, it's choosing the fiscally weakest pattern over the strongest.
San Clemente's traditional neighborhoods weren't built this way by accident. They were built before zoning made this pattern illegal. The question for San Clemente today is whether it will allow more of the development pattern that already works, or continue mandating the one that doesn't.
Data and methodology
Parcel boundaries and assessed values from the Orange County Treasurer-Tax Collector's public ArcGIS service. Value per acre = total assessed value / parcel acreage. Assessed values reflect Prop 13 constraints; market values would be significantly higher for properties purchased before the recent cycle.
This visualization uses the same approach as our Oceanside value-per-acre map. The color scale and height mapping are identical, making the two cities directly comparable.
Stay in the loop on what's happening in Oceanside.